
Method
Survey Period
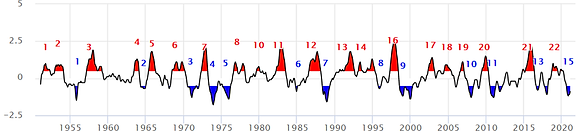
graph from climate.go.kr
Before collecting the data, we first set a survey period.
Five periods were chosen to compare the figures for the El Niño period and the average year. These five periods were selected based on the relatively high El Niño intensity among the El Niño periods. The average period corresponds to the month when El Niño occurred during the non-El Niño period and the non-La Niña period.
And by setting the same months for each, we intended to delete
the seasonal variable that could affect typhoons.
Thus, the periods are divided as below.
Case 1
El Niño period : 2015.03. ~ 2016.02.
Normal period : 2014.03. ~ 2015.02.
Case 2
El Niño period : 2009.06. ~ 2010.04.
Normal period : 2008.06. ~ 2009.04.
Case 3
El Niño period : 2006.08. ~ 2007.01.
Normal period : 2005.08. ~ 2006.01.
Case 4
El Niño period : 2004.06. ~ 2005.05.
Normal period : 2003.06. ~ 2004.05.
Case 5
El Niño period : 2002.05. ~ 2003.03.
Normal period : 2001.05. ~ 2002.03.