
☁️ Result☁️
Intensity
we decided to check the intensity of the typhoon using the following 4 elements,
'lifespan, wind speed, size, and central air pressure'.
life
span
The stronger the intensity of a typhoon is,
the longer the lifespan of the typhoon might be.
Wind
speed
The stronger the intensity of a typhoon is,
the faster the wind speed of the typhoon might be.
size
The stronger the intensity of a typhoon is,
the bigger the size of the typhoon might be.
central
air pressure
The stronger the intensity of a typhoon is, the lower the central air pressure of the typhoon might be.
life span
To see if El Niño affects the life span of typhoons,
we looked at the life span of all typhoons from case 1 to case 5.
In all subsequent graphs, the blue dot refers to a typhoon during the El Niño period
and the orange dot refers to a typhoon in the average year.

< case 1 >

< case 3 >

< case 2 >

< case 4>

< case 5 >
During cases 1, 2,
the lifespan is a little bit longer during the El Nino period than the normal year.
There is no noticeable difference during case 3, 4, 5.
Some cases have noticeable differences and some don’t.
Wind speed
To see if El Niño affects the wind speed of typhoons,
we looked at the average of maximum hourly speeds from case 1 to case 5.
In all subsequent graphs, the blue dot refers to a typhoon during the El Niño period
and the orange dot refers to a typhoon in the average year.

< case 1 >

< case 2 >

< case 3 >

< case 4 >

< case 5 >
In the first, at case 2 and 5,
the average of the maximum hourly speed was high during the El Niño period,
and at cases 3 and 4, the normal period was high.
size
To find out whether El Niño affects the size of the typhoon,
we looked at the average wind radius of typhoons from case 1 to case 5,
and the number of large typhoons and super typhoons that occurred.
Here, large typhoons are typhoons whose radius of the area
with the wind speed of 15m/s and above is from 500km to 799km,
and super typhoons are typhoons with a radius of more than 800km.

< case 1 >

< case 2 >

< case 3 >

< case 4 >

< case 5 >
In the case of the average wind radius, it was significant during the El Niño period at case 2 and case 5, and it was significant in the normal period at cases 1, 3, 4.


The frequency of typhoons that have developed to a large typhoon is higher
during El Niño periods at case 2 and case 5.
And at case 3 and case 4, the development was more frequent during the normal period.
Case 1 showed the same result as zero in both periods.
The number of typhoons developed into super typhoons from case 1 to case 4 was all zero,
but at case 4, the El Niño period was four, more than the normal period.
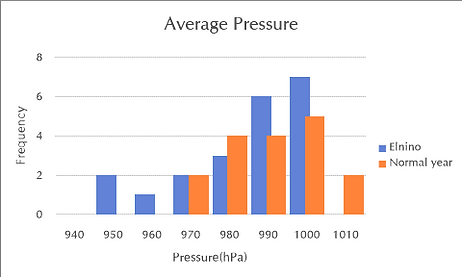
central air pressure
Two values were analyzed to compare the central pressure
of the typhoon during the first to fifth periods.
These two values are the average air pressure from the time a typhoon is created to dissipate, and the minimum air pressure.
In all subsequent graphs, the blue dot refers to a typhoon during the El Niño period
and the orange dot refers to a typhoon in the average year.
<Average air Pressure>

< case 1 >

< case 3 >
< case 2 >

< case 4 >

< case 5 >
In case1 and case 2, the central pressure of the typhoon in El Niño appeared
to be lower than usual, but there was no significant difference in the rest of the periods.
<minimum air Pressure>

< case 1 >

< case 3 >

< case 2 >

< case 4 >
